PyTorch (3) Linear regression
This is an example about Linear Regression with PyTorch.
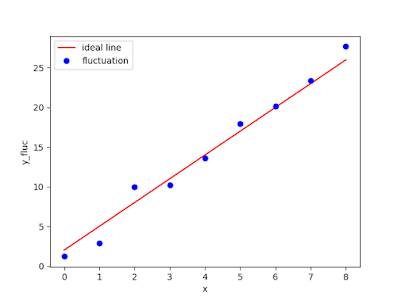
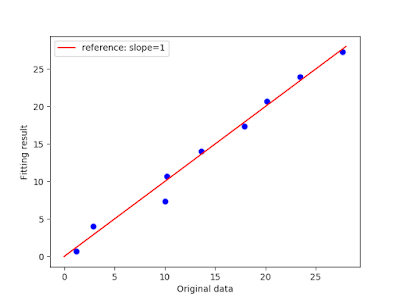
We add the fluctuation to the linear data and fit it with a linear model. Finally, we plot a 2-D figure to show the training result. If the training result perfectly fit the original data, the slope should be 1.
1. Prepare the data to be fitted:
Add the fluctuation to the linear data:
import numpy as np

x = np.array([[xi for xi in range(10)]])
y = 3*x+10
fluctuation = np.random.randn(y.shape[0], y.shape[1])
y_fluc = y+fluctuation
from matplotlib import pyplot as plt

plt.plot(x[0,:], y_fluc[0,:], "o")
plt.show()

2. Construct the model:
We create a class which inherits torch.nn.Module.
A linear layer (torch.nn.Linear) is add to the init process.
class LinearRegression(nn.Module):
    def __init__(self):
        super(LinearRegression, self).__init__()
        # create a linear layer
        self.fc1 = nn.Linear(1, 1)

    def forward(self, x):
        """compute and return the result.
        """
        out = self.fc1(x)
        return out
LinearRegression.forward is used to compute the predictive result.
3. Complete program:
This example use CUDA tensor. Modifing xxx.cuda() to xxx to use CPU tensor.
import torch
from torch import nn, optim

import numpy as np
import matplotlib.pyplot as plt


class Net(nn.Module):
    def __init__(self):
        super(Net, self).__init__()
        self.fc1 = nn.Linear(1, 1)

    def forward(self, x):
        out = self.fc1(x)
        return out


if __name__ == "__main__":
    x = np.array([[i for i in range(9)]], dtype=np.float)  # shape (1,9)
    x = x.T  # reshape to (9, 1) to fit torch
    y = 3 * x + 2  # shape (9, 1)

    plt.figure("Before fitting")
    plt.plot(x[:, 0], y[:, 0], "r-", label="ideal line")  # plot the ideal line
    fluctuation = np.random.randn(y.shape[0], y.shape[1])
    y_fluc = y + fluctuation

    plt.plot(x[:, 0], y_fluc[:, 0], "bo", label="fluctuation")  # plot training data
    plt.xlabel("x")
    plt.ylabel("y_fluc")
    plt.legend()

    x_train = torch.FloatTensor(x).cuda()
    y_train = torch.FloatTensor(y_fluc).cuda()

    mse = nn.MSELoss()
    net = Net().cuda()
    optimizer = optim.SGD(net.parameters(), lr=1e-3)
    steps = 100
    error = []

    for step in range(steps):
        y = net(x_train)
        loss = mse(y, y_train)
        error.append(loss.cpu().detach().numpy())
        optimizer.zero_grad()
        loss.backward()
        optimizer.step()

    plt.figure("Train result")
    plt.plot(y_fluc[:, 0], y.cpu().detach().numpy()[:, 0], "bo")
    plt.xlabel("Original data")
    plt.ylabel("Fitting result")
    plt.plot([0, 28], [0, 28], "r-", label="reference: slope=1")
    plt.legend()

    plt.figure("MSE")
    plt.plot(error)
    plt.show()
We tried to minimize Mean squared error which measures the average of the squares of the errors of the data with SGD optimizer.


留言
張貼留言